download file SelfEconomy2008 in english
download file SelfEconomy2008 in english
Journal français, frlaboplanet2
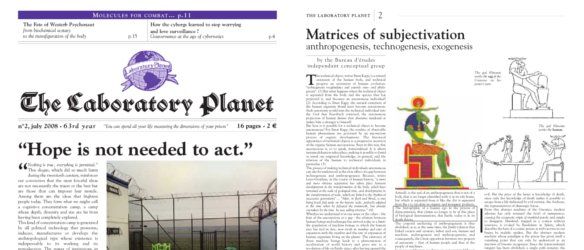
Newspaper english, anglaboplanet_ENG2
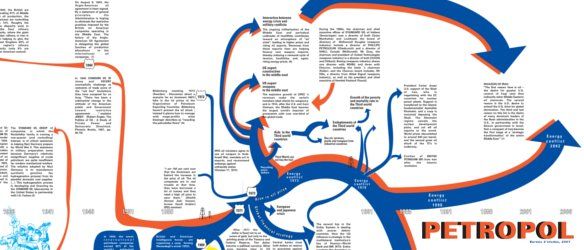
Map PETROLEUM2007 in english

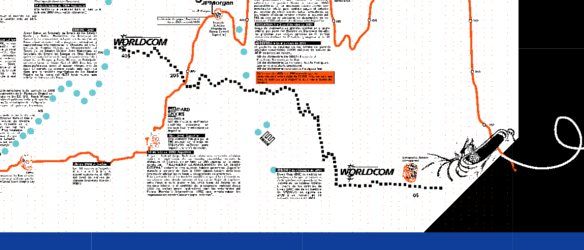
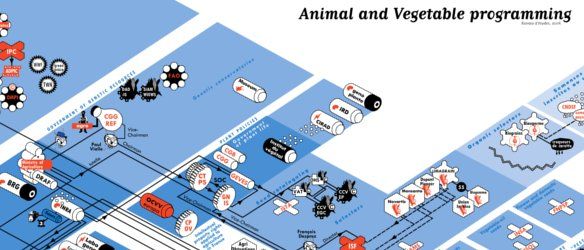
“This work, entitled Crisis functions as a chronology of the world financial system in the 1990s. It attempts to situate the Argentinean revolt within the general framework of a worldwide economic cycle – essentially the period of so-called globalization, from 1989 onward. In the lower third of this long, lateral graphic chart, you see three horizontal axes corresponding to events within the three great currency zones of the Yen, the Euro and the Dollar, with a special bar devoted to the management of the IMF, above, and a line showing the frequencies of so-called “payment incidents,” or delays in the reimbursement of the Argentinean debt, below – a line which also serves to mark political events such as the election of Menem in 1989. The middle section of the chart widens the focus to look at strikes and riots against privatization processes across the entire world, in the year 2002. The top section unfolds beneath the phrase by Michael Linton, the inventor of the Local Exchange and Trading Systems (or LETS), who speaks of “money as an information system for recording human effort.” Their top section relates the development of alternative monetary systems over the decade of the 90s, culminating in the spectacular expansion of the Argentinean Red Global de Trueque system in the years of the crisis. In short, this chronology looks both at the failure of the financial markets, and at the popular responses to these failures – in an approach very close to the logic of the “double movement” described by Karl Polanyi. The first part of the chronology deals with the restructuring of the Japanese and American banking systems in the early nineties, after the first round of financial expansionism during the preceding decade. Then we see the tumult of great Asian crisis, with the radical inflation that hit the currencies of the East Asian region, after years of excessive speculation on the “tiger”economies. The crisis began with an attack on the Thai currency, the bhat, which rose from 30 to over 50 for one US dollar, as you can see in the suddenly rising jagged line of the chronology. Even worse was the case of the Indonesian rupee, marked at the height of its inflationary climb with the head of the authoritarian leader Suharto, who would fall along with the precarious living standard of the Indonesian people. But the graphic chart shows very clearly that the capitals fleeing the speculative krach of the East Asian economies found a perfect new home on the US stock market, where the values of companies like WorldCom and Enron shot up precipitously at the end of the millennium, before falling dramatically when the new economy bubble finally burst in mid-2000. There’s a perfect correlation, at this point, between the fall of the Northern stock markets and the rise in the “payment incidents”affecting the reimbursement of the Argentinean debt. The world economy is so tightly integrated that the long process of Argentina’s economic decay enters its crisis at the very moment when the American bubble bursts. The same line of rising “payment incidents” shows the key events in the social history of those tumultuous months: the corralito – or the closure of the Argentinean public banking system, before the currency’s radical devaluation – the withholding of a final loan by the IMF, the flight of De la Rua, the formation of the Piquetero Bloc of unemployed industrial workers, etc.” (Brian Holmes, 2005. Extract of “Remember the Present, Representations of Crisis in Contemporary Argentina”)
Map CRISIS in spanish
Journal en français – LABELLEAUBOISDORMANT
4 cartes sur le systeme agro-alimentaire :
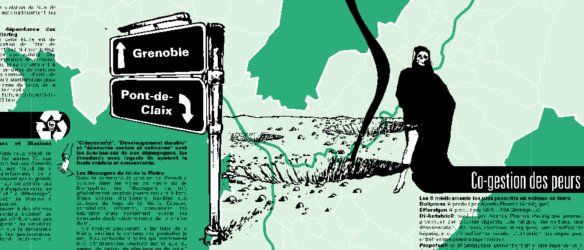
Chronologie des liens entre recherche, armée et politique à Grenoble depuis 1900, Carte chronologie français.
Géographie de la Techno-ville de Grenoble, Carte geographieVilleGrenoble français.

Ce poster, affiché dans les abri-bus de la Ville de Riga (Lettonie) signalait les emplacements des antennes de téléphonie mobile dans la ville et les effets sanitaires qu’elles pouvaient provoquer.
Download POSTER
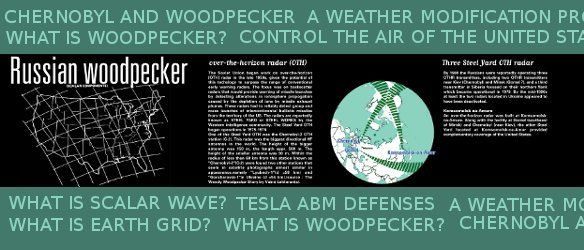
What is Woodpecker ? The term Woodpecker refers to the high-power OTH radar which operated in Europe during the years 1976 – 1986. The signal from the Chernobyl-2 OTH station (C-2) is pulse-modulated at a rate of several times a second [most sources state 10 pulses per second], sounding like a woodpecker. The radar was observed using three repetition rates: 10 Hz, 16 Hz and 20 Hz. The most common rate was 10 Hz, while the 16 Hz and 20 Hz modes were rather rare. The pulses transmitted by the woodpecker had a wide bandwidth, typically 40 kHz. Also in the 2000s on the HF bands, over-the-horizon radars from other countries, using other pulse frequencies, have been audible. The 10-Hz Woodpecker was, and will be remembered as a unique phenomenon that generated more interference reports and speculations than any other radio emission. When it first began operations, the transmitter interfered with several communications channels, including emergency frequencies for aircraft on transoceanic flights. Subsequently the operational practice was modified so that the radar skipped these critical frequencies as it moved across its operational spectrum. When the transmissions were first detected in the West, some suggested that the Soviets were developing a new radio system for communicating with strategic submarines. Others suggested that it was designed to detect and track low-flying aircraft or missiles. Far less plausible theories extended to suggestions the Soviets were trying to modify the weather; experimenting with radio waves to control human behavior; or developing a weapon to shoot down nuclear-tipped missiles. (source : ABM AND SPACE DEFENSE A. Karpenko Nevsky Bastion, No. 4, 1999, pp. 2-47 and The Woody Woodpecker Story by Väinö Lehtoranta)
Download mapwoodpecker
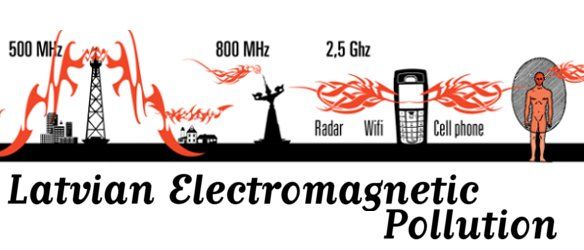
Do you know anything about electromagnetic radiations in Latvia?
The small town of Skrunda, 150 km from Riga in Latvia, was the site of two HEN HOUSE radars built in the 1960s. Construction of the Dnestr-M radar, which was stationed in the trans-polar area (RO-1 in Murmansk) and Latvia (RO-2 in Riga), began in 1963-1964. On 15 February 1971, the RO-2 node was put into operation, the first radar station of the system. This date is considered to be an official beginning of Russian early warning system organization.
Construction of a PECHORA [Daryal] class large phased array radar at the so-called “northern center” began in 1984. The 60-meter structure was to have been one of the most important Soviet stations for listening to objects in space. The Skrunda PECHORA radar building was destroyed by explosive charges on 04 May 1995. A similar station under construction in Baranovichi, Belarus, will resolve all the problems caused by the closure of the Skrunda station.
The Skrunda station created a strong electromagnetic radiation zone. During recent years several studies on impact of radiation on environment and humans have been performed in the territory of Skrunda Station. At the same time biological beings were prohibited from staying for longer periods of time in a 300 m zone area around locators during the operation of the station. In the direction of radiation any building was prohibited in an area of 1500 m
Voir le PDF : LatvianEMpollutio